
What is regression to the mean?
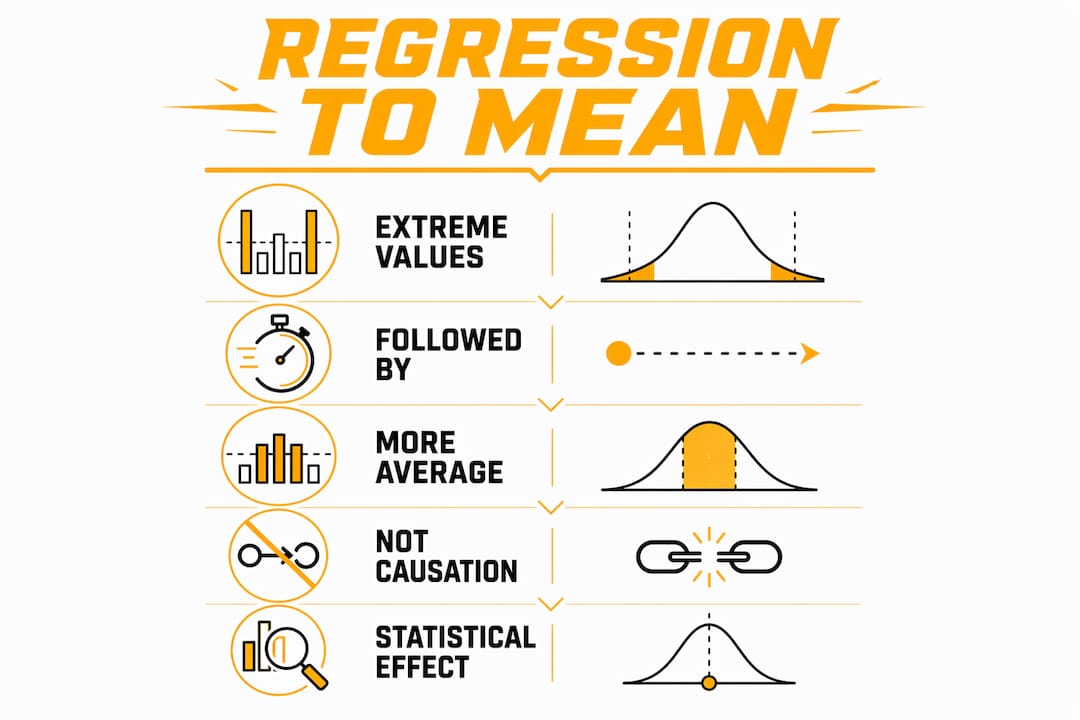
Extreme results tend to be followed by more average ones. That's the core of regression to the mean, and once you see it, you will spot it everywhere. A student aces one exam and scores closer to average on the next. A baseball team goes on a historic winning streak, then cools off. A fund manager posts a record year, then delivers mediocre returns. None of these shifts require an explanation involving effort, strategy, or luck running out. The math does the work on its own.
Regression toward the mean is a statistical phenomenon where extreme values tend to be followed by values closer to the population average, purely because of variability in systems with random components. It's not a force pulling results back to center. It's just what happens when chance plays a role in any outcome.
A few key ideas to hold onto:
- Extreme value: Any result that sits far above or below the typical range for a given population.
- Mean: The average of all values in a population or dataset.
- Random component: The portion of any outcome driven by chance rather than skill or fixed ability.
- Imperfect correlation: When two measurements of the same thing don't perfectly agree, regression effects appear.
- Regression effect: The tendency for follow-up measurements to land closer to the average than the first measurement did.
Regression to the mean shows up in medicine, sports analytics, finance, psychology, and education. Recognizing it doesn't just satisfy intellectual curiosity. It prevents costly mistakes in how you interpret data and make decisions.

Real-world examples that show regression to the mean in action
The clearest way to understand mean reversion is to watch it happen in situations you already know.
Student test scores are a classic case. Imagine a class takes a standardized test. The students who score in the top 5% on the first attempt will, on average, score lower on a second attempt, even with no additional studying. Why? Because their first score likely included a lucky streak of guessing correctly, a topic they happened to review the night before, or simply a good day. Those random advantages don't repeat reliably. The same logic applies to the bottom scorers, who tend to improve on a retest, not because they studied harder, but because their worst-day performance included random bad luck that won't fully repeat.
- Sports team performance: A team that wins 14 of its first 16 games will almost certainly finish the season closer to a .500 record. Extreme performances in sports naturally moderate over time, reflecting statistical regression rather than a collapse in talent or coaching.
- Investment returns: A mutual fund that ranks in the top 1% one year tends to fall back toward average performance the following year. The exceptional year often reflects favorable market conditions or concentrated bets that paid off, not a repeatable edge.
- Blood pressure readings: A patient measured with unusually high blood pressure on one visit will often show a lower reading at the next appointment, even without medication. Doctors who don't account for this can wrongly credit a treatment that did nothing.
- Rookie of the Year in sports: Athletes who win this award frequently underperform relative to their debut season in year two. Sportswriters call it the "sophomore slump," but much of it is statistical regression, not a real decline.
- Corporate earnings surprises: A company that wildly beats earnings estimates one quarter tends to post results closer to analyst expectations the next. The beat often reflects one-time factors, not a permanent shift in performance.
The thread connecting all these examples: none of the follow-up changes require a causal story. No intervention, no collapse, no sudden improvement. The random factors that pushed the first result to an extreme simply don't stack up the same way twice.
Pro Tip: When you see a dramatic result in any repeated measurement, ask yourself how much of it could be random before you build a narrative around it.
Why regression to the mean matters, and where people go wrong
The regression fallacy is one of the most common errors in human reasoning. It happens when someone wrongly attributes natural fluctuations around the mean to a specific cause, intervention, or decision. The result is false credit or false blame for something that would have changed on its own.
Here's where this gets genuinely costly:
- Medical research without control groups: If you give a treatment only to patients who are at their worst, many will improve simply because extreme symptoms tend to moderate. Without a control group, that improvement looks like proof the treatment works. Including a control group and repeated measures is the standard way to separate real effects from statistical noise.
- Performance management: A manager praises an employee after a great week and criticizes them after a bad one. The employee then performs closer to average both times. The manager concludes that praise doesn't help but criticism does. That's the regression fallacy in action.
- Coaching decisions in sports: A coach benches a player after a terrible game. The player performs better in the next game. The coach credits the benching. The player's poor game was likely a low point that would have corrected itself regardless.
- The Gambler's Fallacy: This is a related but distinct error. The Gambler's Fallacy assumes that a run of bad outcomes makes a good outcome "due." Regression to the mean reflects the statistical fact that extreme observations are rare and averages are common. It does not mean the next event is influenced by the previous one.
- Survivorship bias: When you only study the top performers, you miss the full distribution. The stars you observe are partly products of luck, and their follow-up performance will regress toward the real average.
The critical distinction: regression to the mean is not causation. Confusing the two leads to incorrect conclusions about whether an intervention or strategy actually worked. Correlation between two measurements tells you how strongly they're related. Regression to the mean tells you what to expect from a follow-up measurement when the first was extreme. Neither tells you why the change happened.

The formal statistics behind regression to the mean
The math here is more accessible than it looks. Start with the correlation coefficient, labeled r, which measures how strongly two measurements of the same variable are related. It runs from 0 (no relationship) to 1 (perfect relationship).
The formula for quantifying regression to the mean is straightforward:
Percent of regression = 100(1 − r)
So if r = 0, regression is 100%: the second measurement tells you nothing about the first, and you'd expect it to land right at the mean. If r = 1, regression is 0%: the measurements are perfectly correlated, and no regression occurs. Most real-world measurements fall somewhere in between, which is exactly why regression effects appear so consistently.
For a bivariate normal distribution, the relationship becomes even cleaner. If X and Y follow a bivariate normal distribution with correlation r, the conditional expected value of Y given X is:
E(Y | X) = μ_Y + r · (σ_Y / σ_X) · (X − μ_X)
What this says in plain language: if X is t standard deviations above its mean, the expected value of Y is only r × t standard deviations above its mean. Since r is always less than or equal to 1, Y is always predicted to be closer to its mean than X was to its own. That's the mathematical core of regression toward the mean.
| Correlation (r) | Regression to mean | Practical meaning |
|---|---|---|
| 0 | 100% | Second measure is pure average; first tells you nothing |
| Low (e.g., 0.3) | 70% | Strong pull back toward the mean |
| Moderate (e.g., 0.7) | 30% | Moderate regression; first measure still matters |
| 1 | 0% | Perfect prediction; no regression at all |
A few numbered points that tie the math to practice:
- Imperfect correlation drives regression. Any time r is less than 1, regression effects appear. Perfect correlation never exists in real-world data.
- Standardized scores make the effect visible. When you convert raw scores to z-scores, the regression effect shows up as a predicted z-score closer to zero than the observed one.
- Sampling distributions confirm it. Subsequent averages drawn from a population are more likely to be less extreme than any single extreme draw, which is why sampling distributions naturally produce regression effects.
- Experimental design must account for it. Any study that selects participants based on extreme scores at baseline will observe regression toward the mean at follow-up, regardless of any treatment applied.
How the concept was discovered and how it has evolved
Francis Galton stumbled onto regression to the mean while studying something entirely different: the inheritance of height. In the 1880s, he measured the heights of parents and their adult children across hundreds of families. His finding was counterintuitive. Tall parents tended to have children who were taller than average, but shorter than the parents themselves. Short parents had children who were shorter than average, but taller than the parents. The offspring heights regressed toward the population mean, generation after generation.
Galton called this "regression toward mediocrity," a phrase that sounds harsh but was purely descriptive. He estimated the regression coefficient for height at roughly 2/3: if parents were three inches taller than average, their children would be about two inches taller than average. That single observation gave statistics the word "regression," and Galton's work in quantifying it invented linear regression analysis as a field.
Key milestones in how the concept developed:
- 1886: Galton publishes "Regression towards mediocrity in hereditary stature," introducing the formal concept.
- Early 20th century: Karl Pearson and others extend Galton's work into correlation theory and multivariate statistics.
- Mid-20th century: Psychologists begin documenting regression fallacies in clinical and educational settings, showing how the effect misleads practitioners.
- 1970s: Daniel Kahneman and Amos Tversky identify regression to the mean as a systematic source of cognitive bias, showing that people consistently fail to account for it when predicting outcomes.
- Late 20th century onward: Sports analytics, financial modeling, and epidemiology all incorporate regression to the mean as a standard consideration in study design and performance evaluation.
The modern understanding is clear on one point that Galton's era missed: regression to the mean is a statistical artifact, not a biological or physical force. It doesn't mean talent is being diluted or that excellence is self-correcting. It means extreme observations contain random components that don't persist. In financial markets, for instance, the mean itself can shift when fundamentals genuinely change, so blindly expecting reversion to a historical average can be its own error. The concept has grown from a curiosity in heredity research into a foundational principle across every field that measures anything twice.
Key Takeaways
Regression to the mean is a statistical phenomenon, not a causal force, and recognizing it prevents systematic errors in research, sports analysis, medicine, and financial decision-making.
| Point | Details |
|---|---|
| Core definition | Extreme values are followed by values closer to the average due to random variability, not intervention. |
| Quantifying the effect | The formula percent regression = 100(1 − r) shows how strongly correlation drives regression back toward the mean. |
| The regression fallacy | Wrongly attributing natural return-to-average behavior to a specific cause is one of the most common errors in data interpretation. |
| Historical origin | Francis Galton discovered the concept in the 1880s studying inherited height, and his work gave statistics the term "regression." |
| Practical safeguard | Control groups and repeated measures in study design are the standard tools for separating genuine effects from regression to the mean. |

Regression to the mean shows up constantly in sports betting, and most bettors never account for it. A team that just went on a five-game winning streak isn't necessarily better than its season-long numbers suggest. A pitcher with a 1.80 ERA through four starts is almost certainly going to drift back toward his career average. Knowing the difference between a real performance shift and a statistical blip is exactly the kind of edge that separates sharp bettors from the crowd. Badbets runs daily mathematical models across MLB, NFL, NBA, and college football to identify where sportsbook lines haven't caught up with what the numbers actually say. Every pick is free, every model is transparent, and there are no paywalls. Check out Badbets model picks and start seeing the numbers the way the math sees them.